This report describes the ‘gggrid’ package, which provides a convenient interface for making use of raw ‘grid’ functions in combination with ‘ggplot2’.
The ‘gggrid’ package provides two functions, grid_panel() and grid_group(), both of which create a new layer in a ‘ggplot2’ plot. The first argument to both functions is a ‘grid’ grob or a function that generates a grob and that grob is added to the plot region of the ‘ggplot2’ plot.
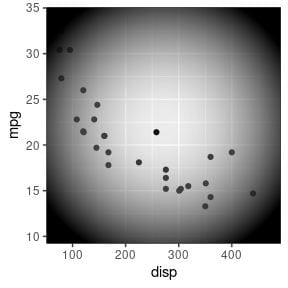
For example, the following code adds a rectangle filled with a semitransparent radial gradient to a ‘ggplot2’ plot.
library(gggrid)
grad <- radialGradient(c("transparent", "black"), r2=.6)
ggplot(mtcars) +
    geom_point(aes(disp, mpg)) +
    grid_panel(rectGrob(gp=gpar(fill=grad)))
Paul Murrell